در این بخش میرسم به بررسی دادههای X-ray از قفسهی سینه و پیمایش در دادهها و آشنا شدن با دیتاست و اعمال عملیات پیش پردازش بر روی دادهها (همیشه قبل از پیادهسازی الگوریتم های یادگیری ماشین باید اینکار رو انجام بدیم)
برای کار کردن با دیتاست و انجام محاسبات ریاضی بر روی دیتا باید از کتابخونه های pandas و numpy استفاده کنیم.
import pandas as pd import numpy as np import matplotlib.pyplot as plt %matplotlib inline import os import seaborn as sns sns.set() # Read csv file containing training datadata train_df = pd.read_csv("nih/train-small.csv") # Print first 5 rows print(f'There are {train_df.shape[0]} rows and {train_df.shape[1]} columns in this data frame') #There are 1000 rows and 16 columns in this data frame train_df.head() #return 4 rows of data set

پس از آشنا شدن با مجموعهی دادهها و ستون های موجود در دیتاست حال باید نوع دادههای هر ستون و تعداد دادههای از دست رفته در یک ستون را به دست آوریم پس دستور زیر را وارد میکنیم
 # Look at the data type of each column and whether null values are present
train_df.info()
خروجی دستور بالا به صورت زیر است
<class 'pandas.core.frame.DataFrame'>
RangeIndex: 1000 entries, 0 to 999
Data columns (total 16 columns):
Image                 1000 non-null object
Atelectasis           1000 non-null int64
Cardiomegaly          1000 non-null int64
Consolidation         1000 non-null int64
Edema                 1000 non-null int64
Effusion              1000 non-null int64
Emphysema             1000 non-null int64
Fibrosis              1000 non-null int64
Hernia                1000 non-null int64
Infiltration          1000 non-null int64
Mass                  1000 non-null int64
Nodule                1000 non-null int64
PatientId             1000 non-null int64
Pleural_Thickening    1000 non-null int64
Pneumonia             1000 non-null int64
Pneumothorax          1000 non-null int64
dtypes: int64(15), object(1)
memory usage: 125.1+ KB
در خروجی بالا میبینیم که هیچ کدوم از فیلد ها NULL نیستند و در ستون سوم هم نوع دادههای هر ستون رو میتونیم ببینیم (نکتهی قابل توجه به جز ستون Image و PatientId هر کدوم از ستونها مربوط به یک بیماریه که ممکنه از در یه تصویر تشخیص داده شده باشه که مقدار هر فیلد ۰ یا ۱ هست که ۰ به معنای عدم وجود بیماری و ۱ به معنای وجود بیماری هست)
مرحلهی بعدی پیدا کردن ایدیهای تکراری هست که ممکنه از یک مریض چندتا تصویر موجود باشه که باید مراقب اینجور رکوردها باشیم که جلوتر دلیل اون رو بررسی میکنیم
print(f"The total patient ids are {train_df['PatientId'].count()}, from those the unique ids are {train_df['PatientId'].value_counts().shape[0]} ")
#The total patient ids are 1000, from those the unique ids are 928
خوب حالا باید بیایم و تمام برچسبهای ممکن که در دیتاست داریم رو پیمایش کنیم (برچسبها همون عنوان ستون ها هستند که گفتیم هر کدوم یه بیماریه)
# Remove unnecesary elements
columns.remove('Image')
columns.remove('PatientId')
# Get the total classes
print(f"There are {len(columns)} columns of labels for these conditions: {columns}")
#OUTPUT
There are 14 columns of labels for these conditions: ['Atelectasis', 'Cardiomegaly', 'Consolidation', 'Edema', 'Effusion', 'Emphysema', 'Fibrosis', 'Hernia', 'Infiltration', 'Mass', 'Nodule', 'Pleural_Thickening', 'Pneumonia', 'Pneumothorax']
در مرحلهی بعد میایم و تعداد بیماران مبتلا به هر بیماری را محاسبه میکنیم و نمایش میدهیم
# Print out the number of positive labels for each class
for column in columns:
    print(f"The class {column} has {train_df[column].sum()} samples")
#OUTPUT
The class Atelectasis has 106 samples
The class Cardiomegaly has 20 samples
The class Consolidation has 33 samples
The class Edema has 16 samples
The class Effusion has 128 samples
The class Emphysema has 13 samples
The class Fibrosis has 14 samples
The class Hernia has 2 samples
The class Infiltration has 175 samples
The class Mass has 45 samples
The class Nodule has 54 samples
The class Pleural_Thickening has 21 samples
The class Pneumonia has 10 samples
The class Pneumothorax has 38 samples
با توجه به آمارهای فوق درمیابیم که نحوهی توزیع بیماران در دسته بندیهای مختلف به یک اندازه نیست. (همون مشکله class imbalance)
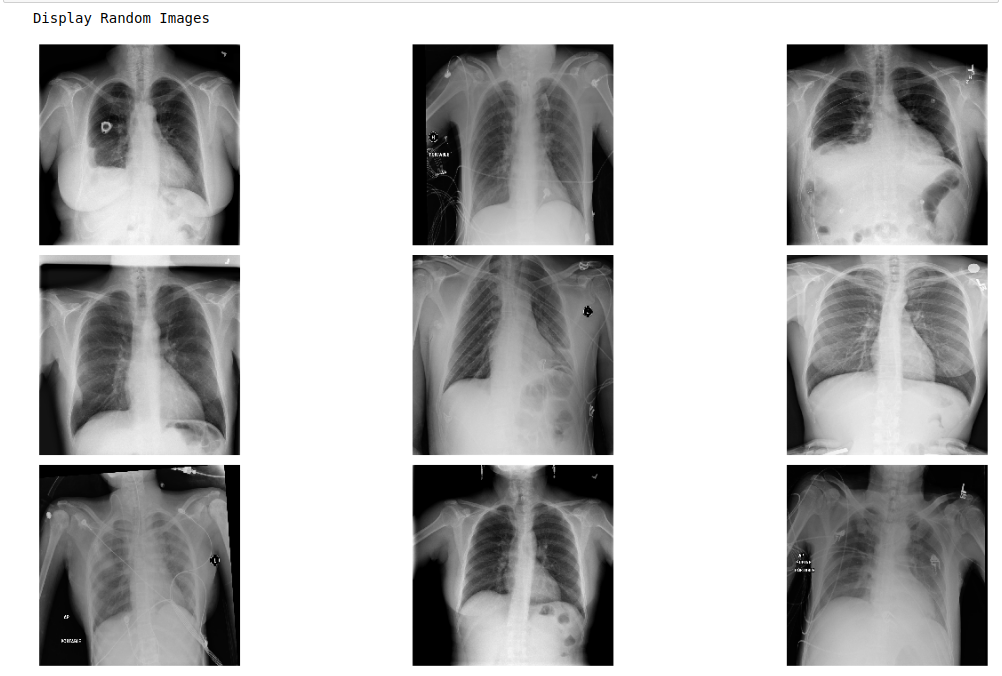
توی این مرحله از نام فایل تصاویر که در ستون Image موجود است استفاده میکنیم برای نمایش رندوم چند تصویر از دیتاست.
# Extract numpy values from Image column in data frame
images = train_df['Image'].values
# Extract 9 random images from it
random_images = [np.random.choice(images) for i in range(9)]
# Location of the image dir
img_dir = 'nih/images-small/'
print('Display Random Images')
# Adjust the size of your images
plt.figure(figsize=(20,10))
# Iterate and plot random images
for i in range(9):
    plt.subplot(3, 3, i + 1)
    img = plt.imread(os.path.join(img_dir, random_images[i]))
    plt.imshow(img, cmap='gray')
    plt.axis('off')
# Adjust subplot parameters to give specified padding
plt.tight_layout()
خوب تا اینجا توی دیتاست خودمون پیمایش کردیم اطلاعات خوبی ازش به دست اوردیم حالا میخوایم بررسیمون رو دقیقتر کنیم و اطلاعات دقیقتری از تصاویر به دست بیاریم برای اینکار تصویر اول دیتاست رو انتخاب میکنیم و اطلاعاتی در مورد تعداد پیکسل، بیشترین و کمترین مقدار پیکسل و مقدار میانهی و انحراف معیار مجموعهی پیکسلها رو چاپ میکنیم
# Get the first image that was listed in the train_df dataframe
sample_img = train_df.Image[0]
raw_image = plt.imread(os.path.join(img_dir, sample_img))
plt.imshow(raw_image, cmap='gray')
plt.colorbar()
plt.title('Raw Chest X Ray Image')
print(f"The dimensions of the image are {raw_image.shape[0]} pixels width and {raw_image.shape[1]} pixels height, one single color channel")
print(f"The maximum pixel value is {raw_image.max():.4f} and the minimum is {raw_image.min():.4f}")
print(f"The mean value of the pixels is {raw_image.mean():.4f} and the standard deviation is {raw_image.std():.4f}")
خروجی کدهای بالا به صورت زیر هست
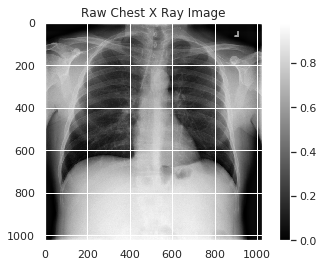
The dimensions of the image are 1024 pixels width and 1024 pixels height, one single color channel
The maximum pixel value is 0.9804 and the minimum is 0.0000
The mean value of the pixels is 0.4796 and the standard deviation is 0.2757
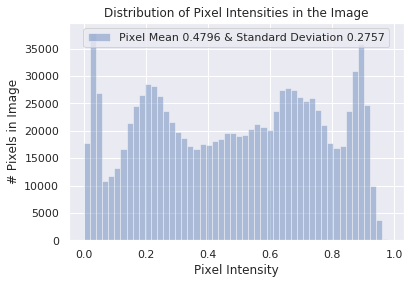
پس از نمایش تصاویر حال نوبت به رسم نمودار توزیع مقادیر پیکسلها رسیده
# Plot a histogram of the distribution of the pixels
sns.distplot(raw_image.ravel(), label=f'Pixel Mean {np.mean(raw_image):.4f} & Standard Deviation {np.std(raw_image):.4f}', kde=False)
plt.legend(loc='upper center')
plt.title('Distribution of Pixel Intensities in the Image')
plt.xlabel('Pixel Intensity')
plt.ylabel('# Pixels in Image')
خروجی قطعه کد بالا به صورت زیر است
Text(0, 0.5, '# Pixels in Image')